


Many scientists were critical of this as it was established that it was in fact the other way around and that there was a lag of about 800 years between rises or falls in temperature and the corresponding rise or fall in CO2 levels. Just one of those studies can be seen here.

In 2012 a new paper published in the science journal Nature reported to show that AL Gore was correct and that CO2 changed first then temperature.
Global warming preceded by increasing carbon dioxide concentrations during the last deglaciation
Jeremy D. Shakun, Peter U. Clark, Feng He, Shaun A. Marcott, Alan C. Mix, Zhengyu Liu, Bette Otto-Bliesner, Andreas Schmittner & Edouard Bard
Abstract:
The covariation of carbon dioxide (CO2) concentration and temperature in Antarctic ice-core records suggests a close link between CO2 and climate during the Pleistocene ice ages. The role and relative importance of CO2 in producing these climate changes remains unclear, however, in part because the ice-core deuterium record reflects local rather than
global temperature. Here we construct a record of global surface temperature from 80 proxy records and show that temperature is correlated with and generally lags CO2 during the last (that is, the most recent) deglaciation. Differences between the respective temperature changes of the Northern Hemisphere and Southern Hemisphere parallel variations in the strength of the Atlantic meridional overturning circulation recorded in marine sediments. These observations, together with transient global climate model simulations, support the conclusion that an antiphased hemispheric temperature response to ocean circulation changes superimposed on globally in-phase warming driven by increasing CO2 concentrations is an explanation for much of the temperature change at the end of the most recent ice age.
METHODS SUMMARY
The data set compiled in this study contains most published high-resolution
(median resolution, 200 yr), well-dated (n5636 radiocarbon dates) temperature records from the last deglaciation (see Supplementary Information for the full database). Sixty-seven records are from the ocean and are interpreted to reflect sea surface temperatures, and the remaining 13 record air or lake temperatures on land. All records span 18–11 kyr ago and,85% of them span 22–6.5 kyr ago. We recalibrated all radiocarbon dates with the IntCal04 calibration (Supplementary Information) and converted proxy units to temperature using the reservoir corrections and proxy calibrations suggested in the original publications. An exception to this was the alkenone records, which were recalibrated with a global core-top calibration41. The data were projected onto a 5u35u grid, linearly interpolated to 100-yr resolution and combined as area-weighted averages. We used Monte Carlo simulations to quantify pooled uncertainties in the age models and proxy temperatures, although we do not account for analytical uncertainties or uncertainties related to lack of global coverage and spatial bias in the data set. In particular, the records are strongly biased towards ocean margins where high sedimentation rates facilitate the development of high-resolution records. Given these issues, we focus on the temporal evolution of temperature through the deglaciation rather than on its amplitude of change. The global temperature stack is not particularly sensitive to interpolation resolution, areal weighting, the number of proxy records, radiocarbon calibration, infilling of missing data or proxy type. Details on the experimental design of the transient model simulations can be found in ref. 25.
The temperature stacks and proxy data set are available in Supplementary Information.
Full Methods and any associated references are available in the online version of the paper at www.nature.com/nature.
PDF files
This file contains Supplementary Text and Data, Supplementary Figures 1-30, Supplementary Tables 1-3, additional References and Supplementary Appendices 1-2.
Excel files
This file contains Supplementary Data.
This paper, however, almost immediately attracted the attention of sceptics who claimed that it relied on "many assumptions that were unsupported by data" in its creation. Professor Don Easterbrook shares his concerns about the Shakun et al paper:
Did Shakun et al. really prove that CO2 preceded late glacial warming? [Part 1]
Posted on April 8, 2012 by Anthony Watts
By Don J. Easterbrook, PhD.
In a paper “Global warming preceded by increasing carbon dioxide concentrations during the last deglaciation”, Shakun et al.(Nature 2012) contend that rising temperature at the end of the last Pleistocene glaciation were preceded by increasing atmospheric CO2. In his usual masterful fashion, Willis Eschenbach has dug deeply into the data used in the paper and shredded the conclusions in it (see http://wattsupwiththat.com/2012/04/06/a-reply-shakun-et-al-dr-munchausen-explains-science-by-proxy/
and http://wattsupwiththat.com/2012/04/07/shakun-redux-master-tricksed-us-i-told-you-he-was-tricksy/#more-60932/. So rather than dwell on the things that Willis has already
shown so well, I thought I’d take a look at some of the assumptions and misconceptions that paper is built upon.
When reading a paper like this, I always like to ask myself, what are the basic assumptions that underlie the methodology involved? What contentions are simply stated as fact or generated in a computer model, rather than demonstrated with real, physical evidence? I will confess here that I don’t believe computer models really prove anything. Sure, they can suggest many things and point out areas of interest, but I live the real world and prefer real physical evidence upon which to base important conclusions. That doesn’t mean I discount models out of hand—it simply means that I look for physical evidence to confirm or deny what the models are saying. So I asked myself a series of questions about the basic issues in this paper. Here are some of the questions that I came up with (the answers follow).
1. Can the Antarctic ice cores be dated with sufficient accuracy to establish a firm temperature chronology?
2. Are the 80 temperature proxies used in the paper sufficiently accurate to establish a solid global temperature chronology?
3. Can CO2 in the ice cores be measured with validity and accuracy?
4. Can the difference in the age of the trapped air and the age of the enclosing ice be determined and is it constant with age?
5. Are CO2 measurements from air bubbles valid or do diffusion and the uncertainty in the timing of isolation of air in bubbles render them invalid?
6. Is the data from Antarctic ice cores consistent with data from the Greenland ice cores?
7. Is the temperature chronology of the ice cores and global proxies consistent with the well-dated, global glacial record?
8. Is the so-called ‘see-saw’ of climate changes between hemispheres valid, i.e, are climate changes in the Northern Hemisphere out of phase with those in the Southern Hemisphere?
9. Would correlation between CO2 and temperature necessarily prove that CO2 causes
climatic warming?
10. Since CO2 is incapable of causing climatic warming by itself (CO2 makes up only 0.038% of the atmosphere and accounts for only a few percent of the greenhouse gas effect), is there evidence of concomitant increase in water vapor (which causes more than 90% of the greenhouse gas effect)?
11. Is the AMOC the only viable causal mechanism? What about the influence of the Pacific Ocean, which covers about half the Earth’s surface
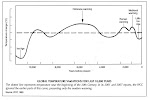
So, what is the main contention of this paper and what does it imply? The authors claim to have “compelling evidence that rising CO2 caused much of the global warming” at
the end of the last ice age, roughly 11,000 to 25,000 years ago. According to the authors, “if you reconstruct temperatures on a global scale – and not just examine Antarctic temperatures – it becomes apparent that the CO2 change slightly preceded much of the global warming, and this means the global greenhouse effect had an important role in driving up global temperatures and bringing the planet out of the last Ice Age.” The crux of their contention is illustrated in their Figure 2.
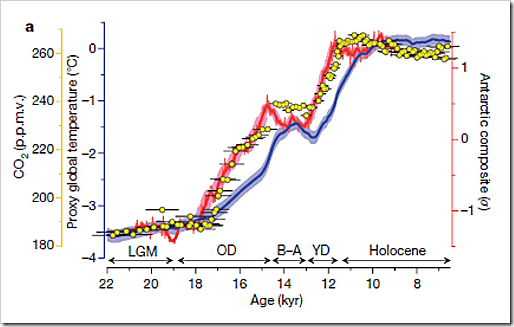
Willis has sliced and diced the data behind these curves so be sure to read his analyses. I’ll refer to some of his graphs and conclusions but look at the Shakun et al. contentions from a somewhat different angle. Because this is such a marked divergence from the widely held view that CO2 lagged rising temperatures at the end of the last ice age, careful scrutiny must be given to evidence and assumptions upon which this contention is based. Right off the bat, a most surprising conclusion in this paper is that the authors claim that correlation proves cause. Simply showing that CO2 correlates with anything surely doesn’t prove that CO2 was
the cause. It’s the same kind of mindset involved with the oft-heard claim that if we have had global warming while CO2 was rising that proves the cause was the rise in CO2. Heck, I had hair before CO2 began to rise, but I don’t blame that on CO2.
So let’s look at each of questions posed above.
- How accurate is the dating of Antarctic ice cores? How can you date ice that has nothing in it that can be directly dated? The Shakun et al. paper states that they use the methodology of Lemieux-Dudon et al. (2010), which involves construction of a model using estimates of snow accumulation rates, temperature, firn densification rates, and ice flow rates, all of which vary from glacier to glacier and from glaciation to interglaciation (thus introducing large potential errors). The modeling data is then modified by matching with tephra horizons, sulfate spikes, δ18O, firn densification model results, and orbital tuning. All of the assumptions built into the modeling are cumulative, resulting in large possible age errors. As Lemieux-Dudon point out “One special feature of glaciological models is a large model error due to unresolved physics and errors on the forcing fields, clearly affecting the quality of the inferred dating scenarios.” What this means of course is that the age determinations of the Antarctic cores are, at best, educated guesses with large uncertainties. Because chronology is so critical to the Shakun et al. contention, the ages of the Antarctic cores shown in their Figure 2 cannot be considered accurate.
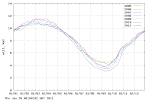
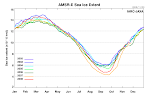
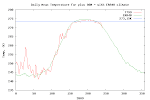
- Are the 80 temperature proxies used in the paper sufficiently accurate to establish a solid global temperature chronology? Willis Eschenbach has made a detailed analysis of the data used to construct the global temperature curve in Figure 2 of Shakun et al.(see this in his web posting) He plotted individual curves for each of the 80 temperature proxies used to create Figure 2 in the Shakun et al. paper. What he found was large variability in the data, which led him to conclude that “The variety in the shapes of these graphs is quite surprising Yes, they’re all vaguely alike, but that’s about all. The main curiosity about these, other than the wide variety of amounts of warming, is the different timing of the warming.” When he ploted all the individual proxies all together (see below), the scatter is readily apparent, leading him to conclude: “It’s clear that there is warming since the last ice age.” “But if you want to make the claim that CO2 precedes the warming? I fear that this set of proxies is perfectly useless for that. How on earth could you claim anything about the timing of the warming from this group of proxies? It’s all over the map.”


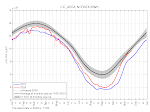
Just for fun, I superimposed the curves on Shakun et al. figure 2 over Willis’s data point plot (see below). Because the global temperature curve (the blue curve) was presumably derived from the data in Willis’s plot, it should fit well with it. Interestingly, it doesn’t. I’ve shown with a blue arrow the dip in temperature that corresponds to the Younger Dryas and a black arrow pointing to what should be the same dip in temperature on the plot of individual data points. Other arrows point to similar differences for the end of the Younger Dryas. Now you
would think that since the Shakun et al. blue curve was constructed from the individual data points shown on the graph, the two should surely be compatible! I’ve also shown on the graph the well-established age of the Younger Dryas—note that the Shakun et al. global temperature data points show a dip in temperature (presumably the Younger Dryas) that is considerably younger. Makes you wonder!

3. Can CO2 in the ice cores be measured with validity and accuracy?
4. Can the difference in the age of the trapped air and the age of the enclosing ice be determined and is it constant with age?
5. Are CO2 measurements from air bubbles valid or do diffusion and the uncertainty in the timing of isolation of air in bubbles render them invalid?
Because these questions are all inter-related let’s consider them together. The validity of measurement of CO2 from bubbles in ice cores has been challenged in a number of studies. There are several basic problems: (1) air becomes trapped in ice during the conversion of snow to firn to ice. Air in the snow/firn phase remains in contact with surface air until it turns to ice and seals off air bubbles from further mixing with surface air. The depth at which sealing occurs varies considerably, depending on the rate of firn densification, and may extend to more than 100 meters and take a thousand years or more. This means that the age of air in a bubble is not the same as the age of the inclosing ice. Snow densification rates vary considerably between temperate and polar glaciers and between glacial and interglacial climates, making it difficult to measure and date adequately. In any case, rates are not likely to be constant. (2) a second problem results from possible diffusion along the walls of an air bubble, which can upset the CO2 concentration in the bubble. These and other problems mean that measurement of CO2 in ice cores is not straight forward—measurement of CO2 concentrations in ice bubbles and determination of the age of the air are likely to be quite variable. General trends are apparent in CO2 ice core measurements, but variability in CO2 concentrations and age remains problematic.
At this point, answering the remaining questions is quite obviously going to take some time, so they will be considered in Part 2, coming soon.
I will update this post when that part is available.
No comments:
Post a Comment